Difference between revisions of "Introduction"
(Created page with 'According to the Census 2001, there are 2.19 crore people with disabilities in India who constitute 2.13 per cent of the total population. This includes persons with visual, hear…') |
|||
| (5 intermediate revisions by the same user not shown) | |||
| Line 1: | Line 1: | ||
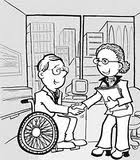
| + | [[File:Dis_eti3.jpg|right]] | ||
| + | |||
| + | When we talk of mainstreaming and inclusion we should not forget that we need to integrate people with disabilities in all spheres of life whether it may be a workplace or a marketplace. Every needs to develop sensitivity towards the people with special needs.Those who provide employment to those with physical challenges need to be more sensitized as it can help them in expanding their businesses and their would be served in a better way. Co-workers, friends and families ought to develop '''"Disability Etiquettes"''' to make them people feel more comfortable and work more efficiently and productively. | ||
| + | Practicing '''"Disability Etiquettes"''' is not at all a difficult thing.No one should feel awkward while dealing with a person have some disability. All what is required is a sensitive heart and little empathy. | ||
| + | |||
According to the Census 2001, there are 2.19 crore people with disabilities in India who constitute 2.13 per cent of the total population. This includes persons with visual, hearing, speech, locomotor and mental disabilities. | According to the Census 2001, there are 2.19 crore people with disabilities in India who constitute 2.13 per cent of the total population. This includes persons with visual, hearing, speech, locomotor and mental disabilities. | ||
| Line 4: | Line 9: | ||
'''Disability data as per Census India 2001''' | '''Disability data as per Census India 2001''' | ||
| + | |||
Disability specific Data | Disability specific Data | ||
| + | |||
Movement 28% | Movement 28% | ||
| + | |||
Seeing 49% | Seeing 49% | ||
| + | |||
Hearing 6% | Hearing 6% | ||
| + | |||
Speech 7% | Speech 7% | ||
| + | |||
Mental 10% | Mental 10% | ||
| + | |||
''Source:Census India 2001'' | ''Source:Census India 2001'' | ||
'''Disability data as per National Sample Survey Organisation (NSSO) 2002''' | '''Disability data as per National Sample Survey Organisation (NSSO) 2002''' | ||
| + | |||
Disability specific Data | Disability specific Data | ||
| + | |||
Movement 51% | Movement 51% | ||
| + | |||
Seeing 14% | Seeing 14% | ||
| + | |||
Hearing 15% | Hearing 15% | ||
| + | |||
Speech 10% | Speech 10% | ||
| + | |||
Mental 10% | Mental 10% | ||
| + | |||
''Source:National Sample Survey Organisation 2002'' | ''Source:National Sample Survey Organisation 2002'' | ||
| − | When | + | When the numbers are so big, then the non disables should try and learn these etiquettes. All this may make people with disabilities feel more confident and relaxed while moving around with people. |
| − | |||
Latest revision as of 09:16, 30 August 2010
When we talk of mainstreaming and inclusion we should not forget that we need to integrate people with disabilities in all spheres of life whether it may be a workplace or a marketplace. Every needs to develop sensitivity towards the people with special needs.Those who provide employment to those with physical challenges need to be more sensitized as it can help them in expanding their businesses and their would be served in a better way. Co-workers, friends and families ought to develop "Disability Etiquettes" to make them people feel more comfortable and work more efficiently and productively. Practicing "Disability Etiquettes" is not at all a difficult thing.No one should feel awkward while dealing with a person have some disability. All what is required is a sensitive heart and little empathy.
According to the Census 2001, there are 2.19 crore people with disabilities in India who constitute 2.13 per cent of the total population. This includes persons with visual, hearing, speech, locomotor and mental disabilities.
Seventy five per cent of persons with disabilities live in rural areas, 49 per cent of disabled population is literate and only 34 per cent are employed. The earlier emphasis on medical rehabilitation has now been replaced by an emphasis on social rehabilitation.
Disability data as per Census India 2001
Disability specific Data
Movement 28%
Seeing 49%
Hearing 6%
Speech 7%
Mental 10%
Source:Census India 2001
Disability data as per National Sample Survey Organisation (NSSO) 2002
Disability specific Data
Movement 51%
Seeing 14%
Hearing 15%
Speech 10%
Mental 10%
Source:National Sample Survey Organisation 2002
When the numbers are so big, then the non disables should try and learn these etiquettes. All this may make people with disabilities feel more confident and relaxed while moving around with people.

